For ecommerce founders and managers

Get your free Profit Tracker

A cut-down version of the tracker we run for our client brands. Paste in your Shopify, Meta and Google exports and it shows what you made after product costs, shipping, payment fees and ad spend, day by day.

A Google Sheet, yours to keep · Free · No credit card

Set up in about 20 minutes

The Dashboard tab of the Profit Tracker, filled with sample numbers
Built by the team behind the ads forOmrubDust & GlowNeat.Good ChangeIf BeautyDrone FishingFlow StateMummy Smoothie
Inside the tracker

What you’ll see

Five views, built from the exports you paste in. These screenshots use made-up numbers.

01 · Dashboard

Your month at a glance

  • Net revenue, ad spend by channel, MER and aMER for the month you pick
  • Each number beside last month’s, so you can see what moved
  • New customers, cost per new customer and average order value
  • Contribution after ads: what’s left once product, shipping, fees and ads are paid

Why it matters: One screen tells you whether this month is ahead of last month, and which number is behind it.
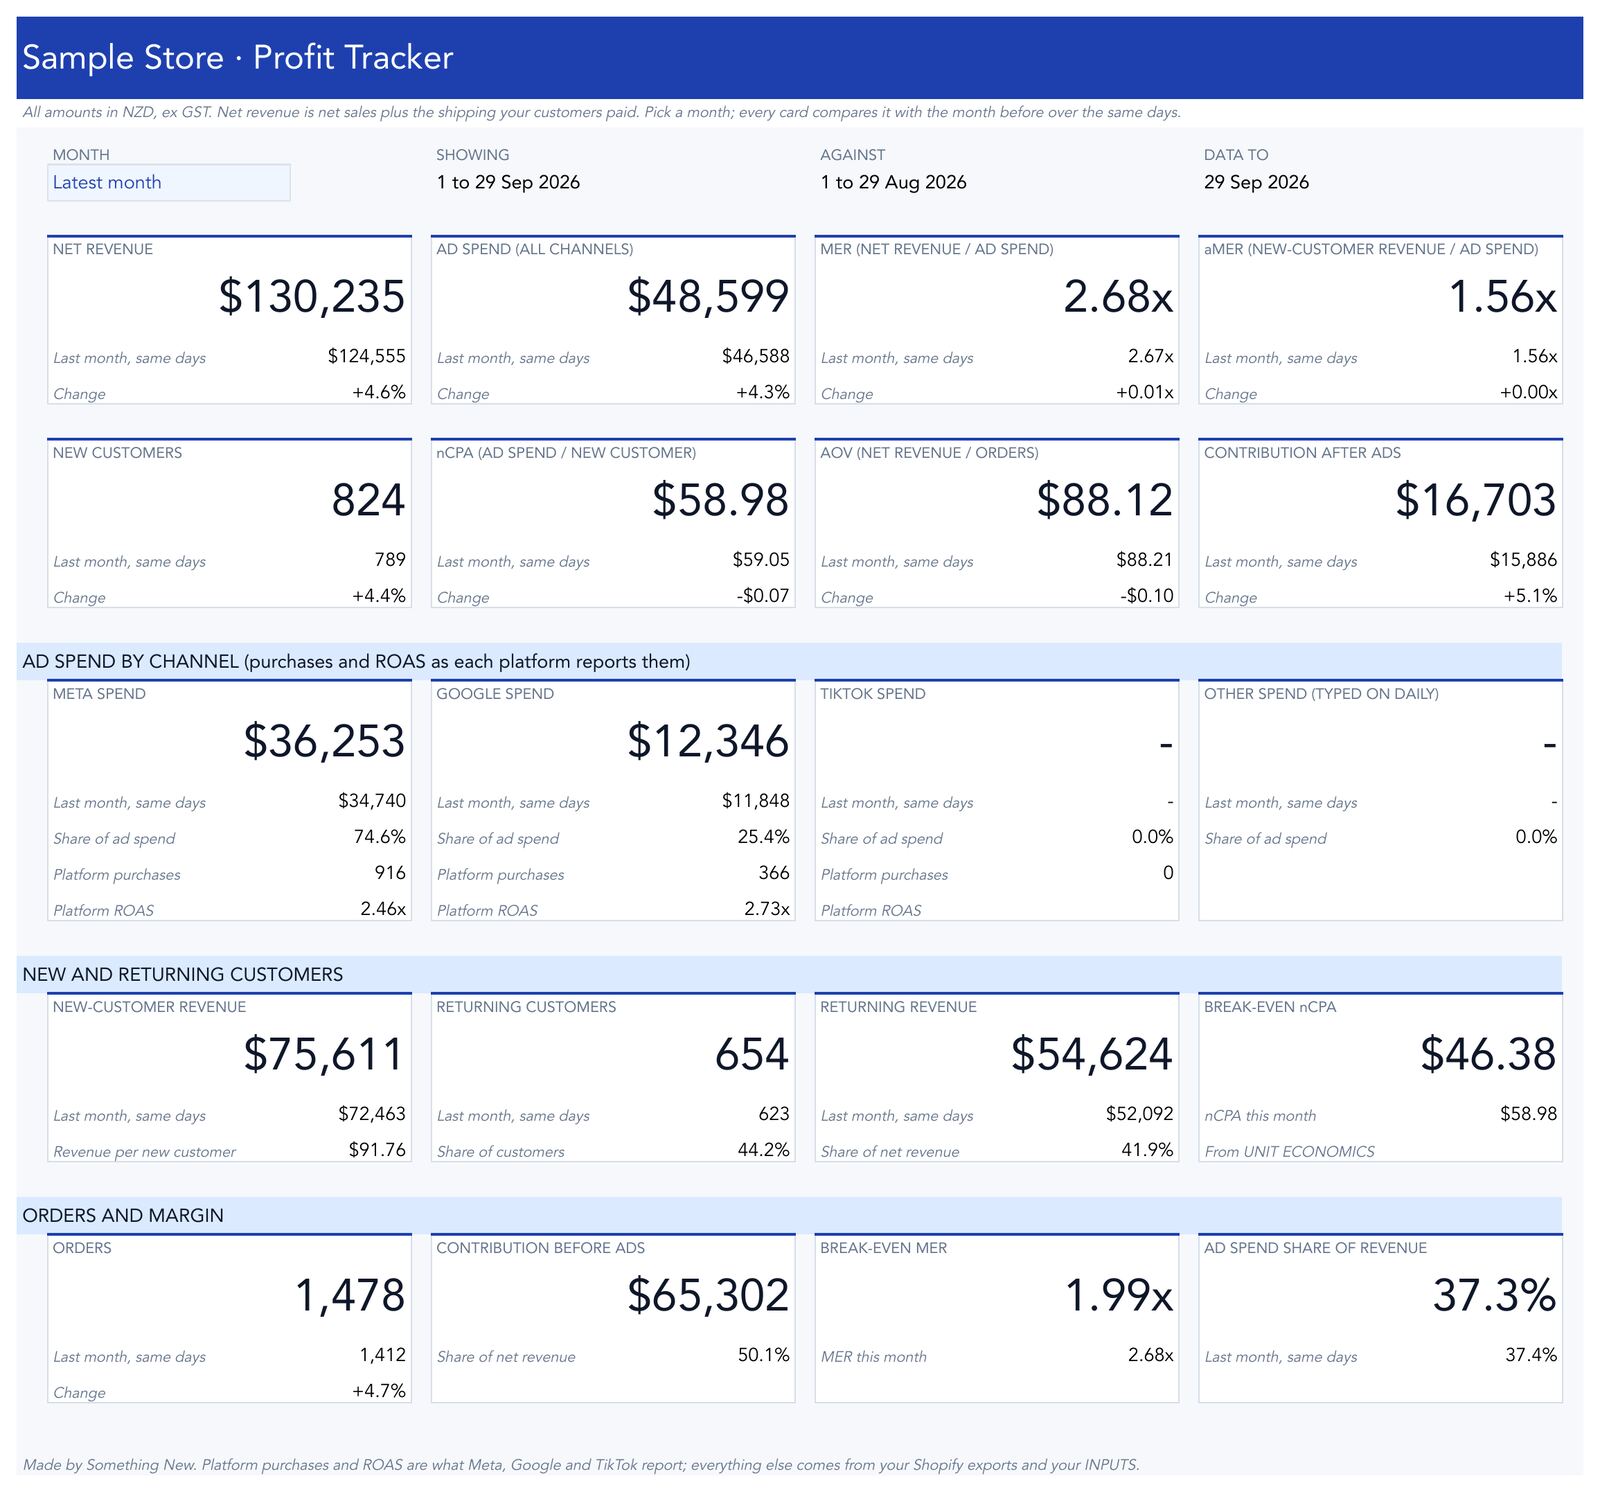
The Dashboard tab of the Profit Tracker, filled with sample numbers
02 · Ad performance

Ad spend and MER, every day

  • Spend per day on Meta and Google, plus TikTok if you run it
  • Total ad spend against the net revenue Shopify actually recorded
  • MER per day: net revenue divided by total ad spend
  • The same numbers rolled up by week and by month

Why it matters: Meta and Google each take credit for some of the same sales. MER only counts revenue that landed in Shopify, so it shows what your total spend is really buying.

The Ad performance tab of the Profit Tracker, filled with sample numbers
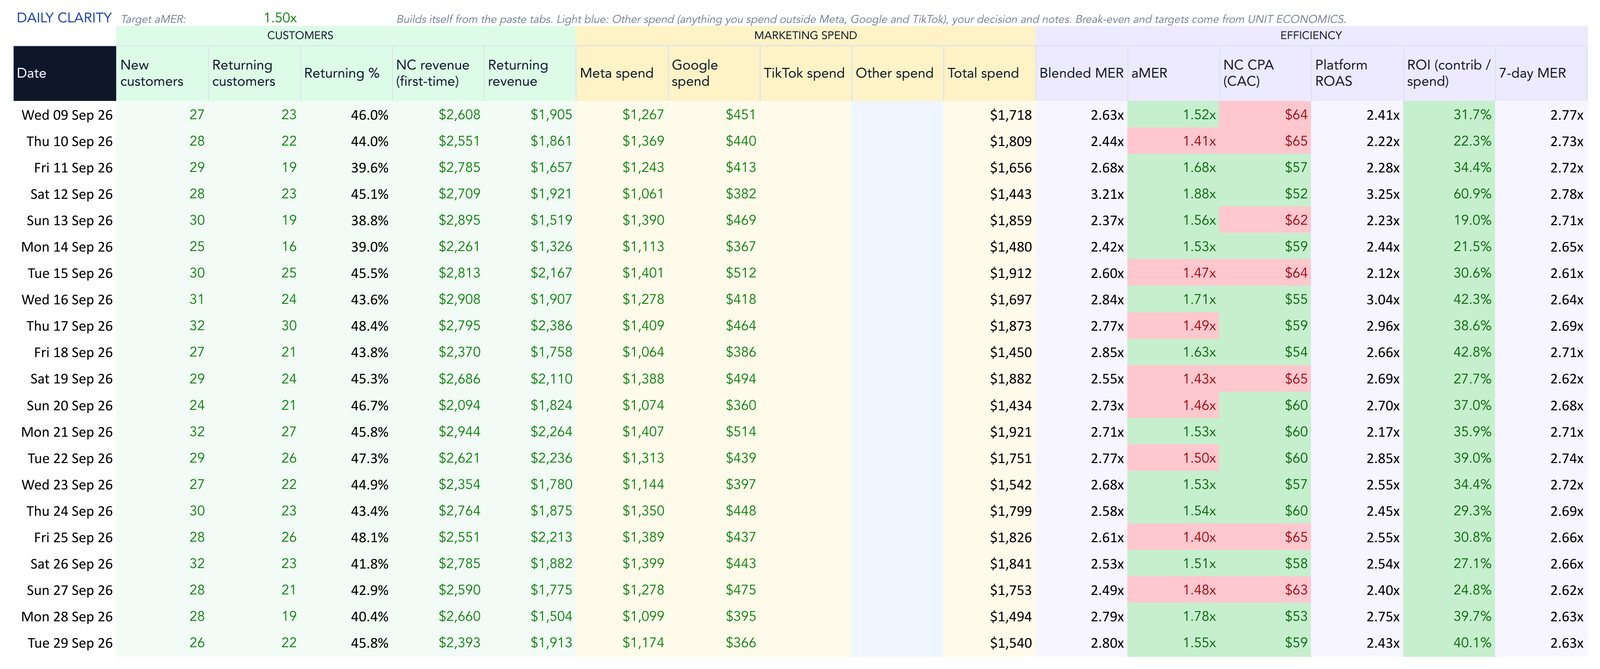
03 · New vs returning

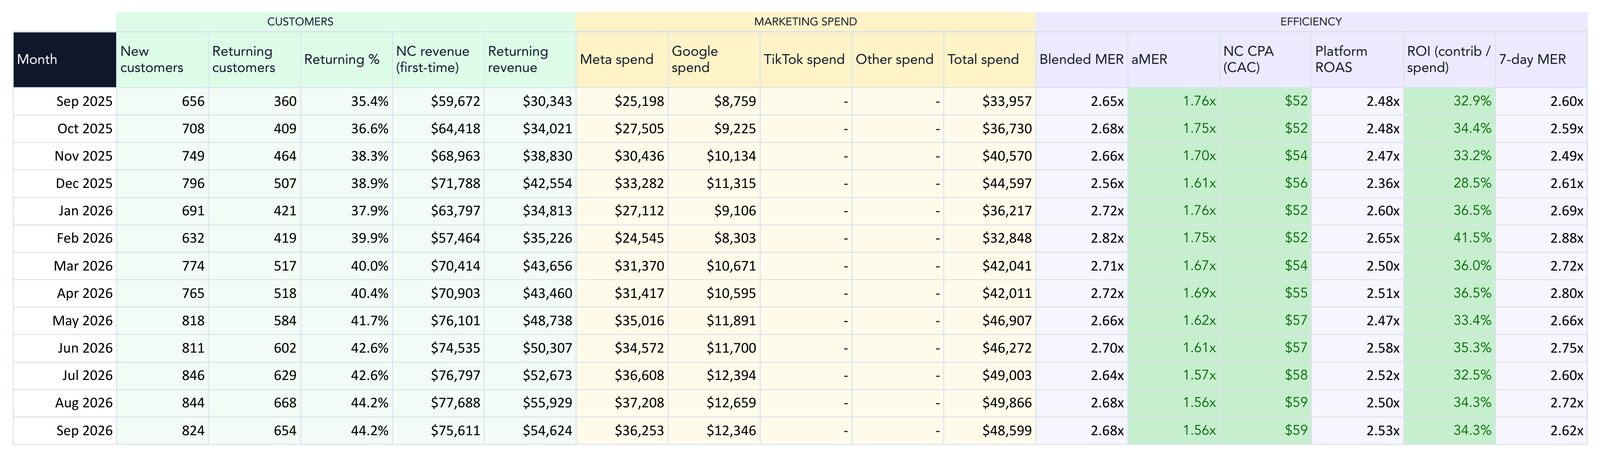
What your ads are buying

  • The share of revenue that came from new customers
  • aMER: new customer revenue divided by ad spend
  • nCPA: what each new customer cost you
  • Average order value across all orders, and for first orders on their own

Why it matters: Returning customers buy whether you advertise or not. Taking them out shows what your ad spend brought in.

The New vs returning tab of the Profit Tracker, filled with sample numbers
04 · Monthly P&L

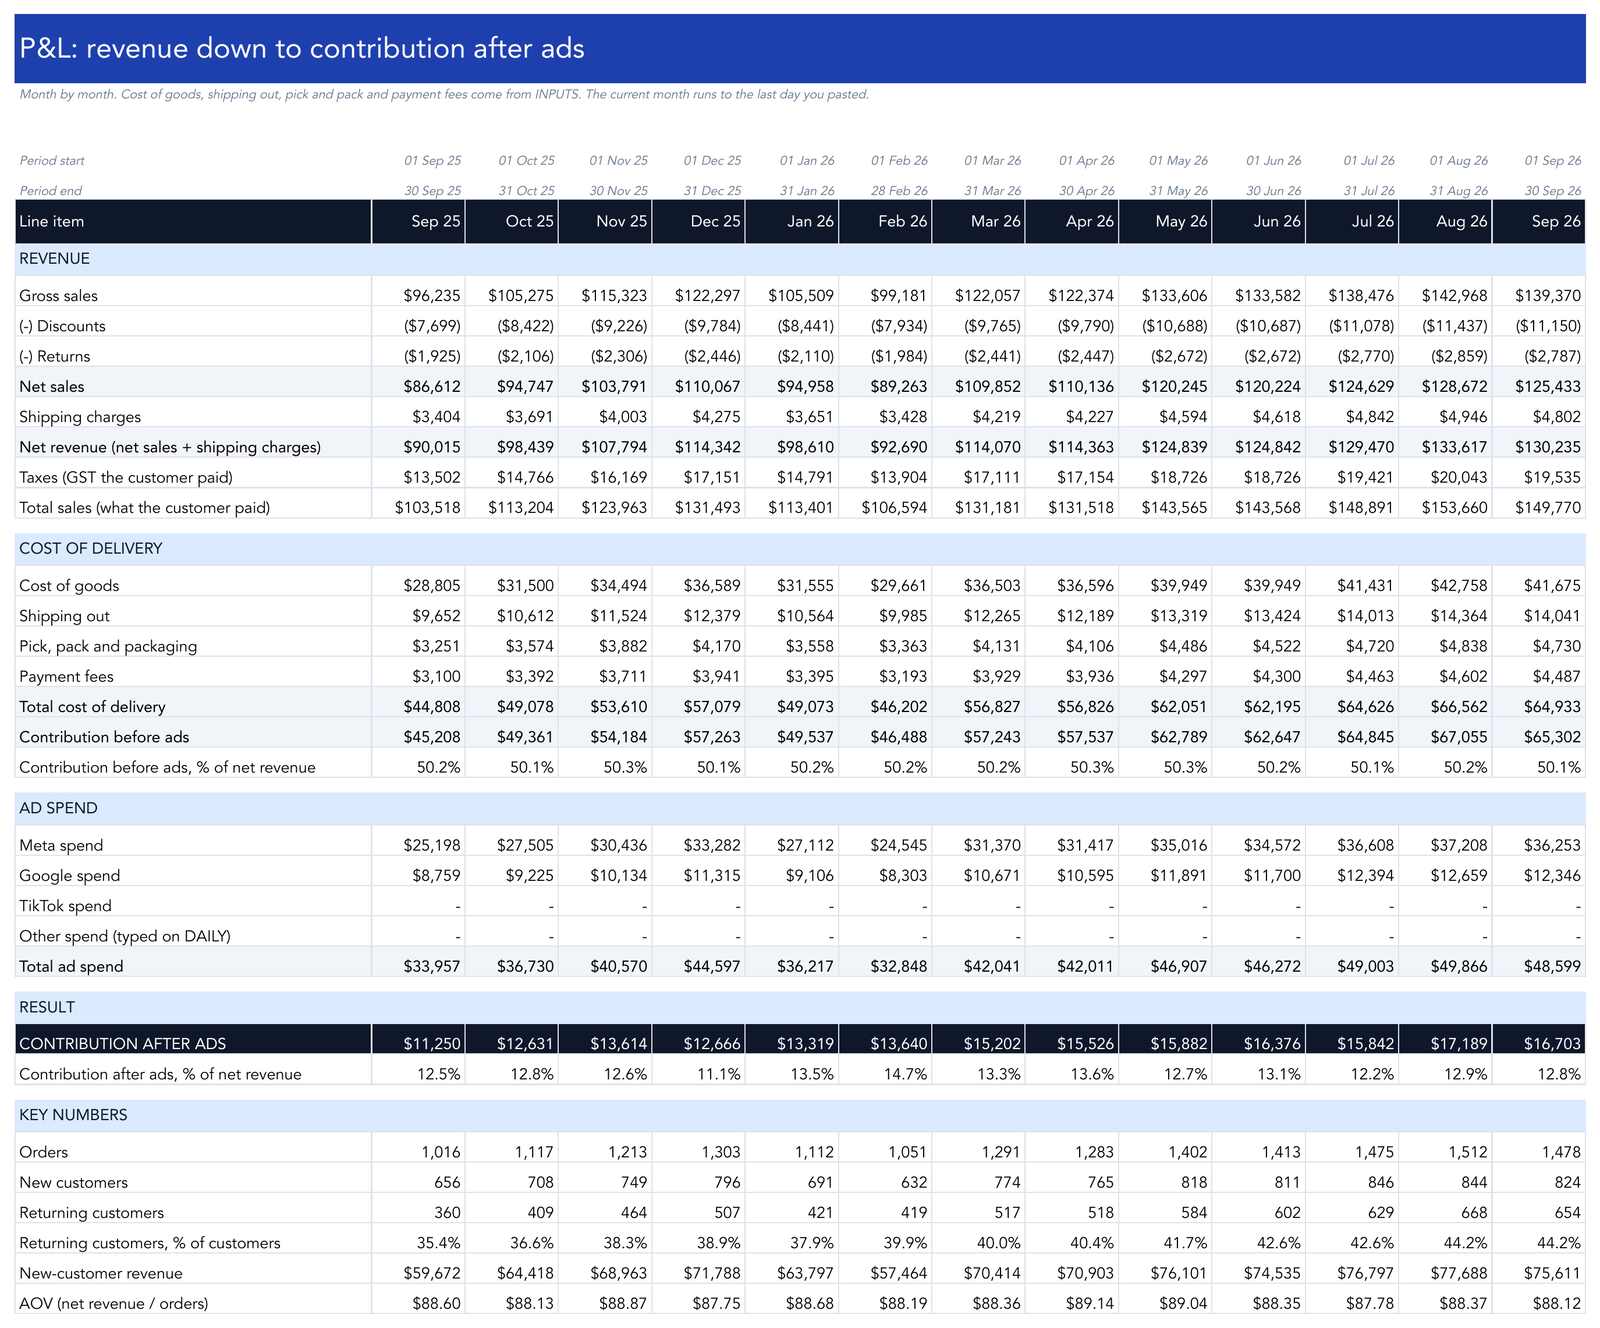
A P&L down to contribution after ads

  • Gross sales, less discounts, returns and GST, to net revenue
  • Cost of goods, shipping and fulfilment, and payment fees taken out
  • Ad spend by channel taken out after that
  • Contribution after ads for each month, in dollars and as a margin

Why it matters: Revenue can grow while contribution shrinks. This shows which one is happening, month by month.

The Monthly P&L tab of the Profit Tracker, filled with sample numbers
05 · Unit economics

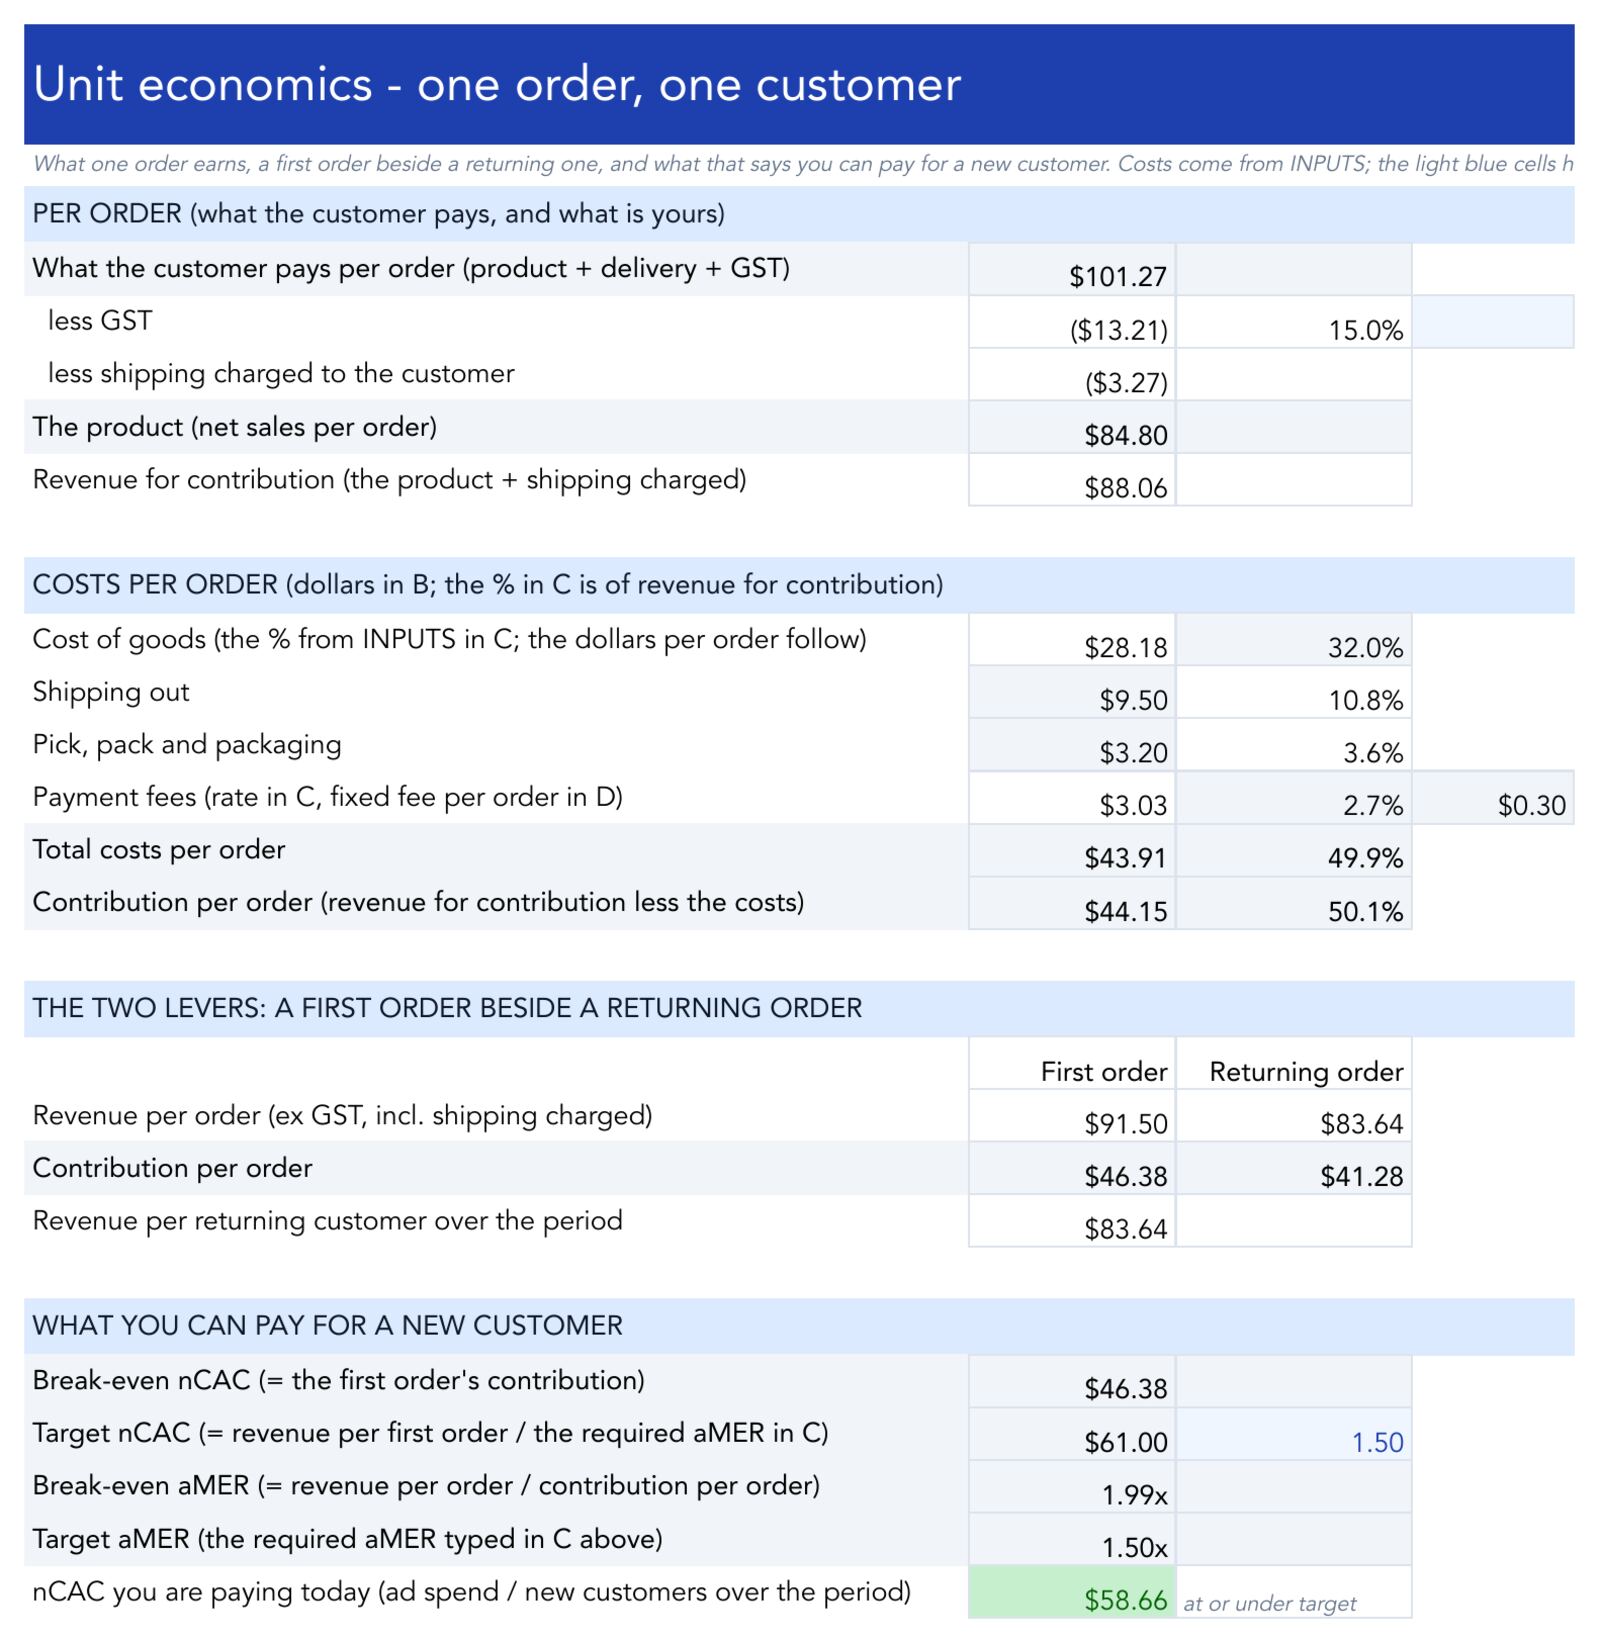
What you can afford to pay for a customer

  • Revenue and contribution on a single order, after GST, product, shipping and fees
  • A first order beside a returning order
  • Your break-even cost per new customer, and a target to aim for
  • Break-even and target aMER, next to what you’re paying now

Why it matters: Without a break-even number, a $40 CPA can look fine or scary depending on the day. This gives you the number to judge it against.

The Unit economics tab of the Profit Tracker, filled with sample numbers

A Google Sheet, yours to keep · Free · No credit card

Set-up

How it works

It runs on exports, not logins. There’s no app to connect to your store or your ad accounts.

1

Make a copy

The link opens your own copy of the Sheet in Google Drive.

2

Fill in your costs

Product cost as a share of your price, shipping and packing per order, payment fees, and whether you charge GST.

3

Paste your exports

Export from Shopify, Meta Ads Manager and Google Ads, and paste each report into its own tab as it comes out. The Sheet shows you which report to pull.

4

Read your numbers

The dashboard, daily view, P&L and unit economics fill in from what you pasted.

The first set-up takes about 20 minutes. After that, paste in fresh exports once a week or once a month and every view updates.

Where it comes from

Built from the numbers we report on for clients

We’ve managed more than $80M in ad spend for ecommerce brands. This tracker is the one we report to them on, with the client-only parts taken out. Here’s what some of those accounts did.

$80M+Ad spend managed across client accounts
Wellness · NZ

Omrub

Case study →
7.1×Monthly ad spend in 6 weeks
−25%CPA while spend rose
Sustainable beauty

Dust & Glow

Case study →
2.1×Monthly ad spend in 1 month
$38CPA held while spend doubled
Eco · subscription

Neat.

$6k → $300kMonthly recurring revenue
Sub-$10Cost per acquisition
Eco · household

Good Change

166%Increase in revenue in 30 days
Beauty · 45+ audience

If Beauty

53%Increase in sales in the first 30 days
Outdoor · seasonal

Drone Fishing

14×ROAS held year-round

Get your free Profit Tracker

Six quick questions. The copy link opens straight away, and we email it to you as well.

A Google Sheet, yours to keep · Free · No credit card

Get your free Profit Tracker

Six quick questions, then your copy opens in a new tab. We’ll email you the link too.

Question 1 of 6

Where we send your copy link.

If you add it, you agree we can text or call you about the tracker.