Drop in your history
Daily spend and revenue, straight from the platform.
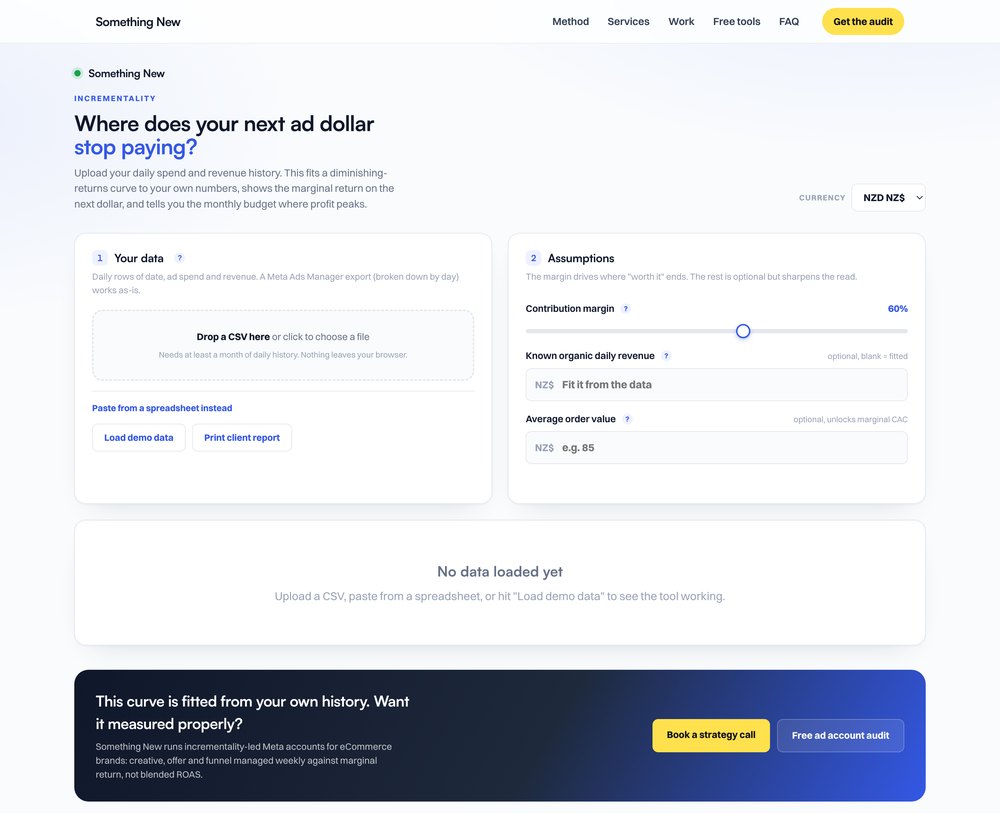
Upload your spend and revenue history. It fits a curve to your own numbers and shows what the next dollar returns against break-even.
An average tells you nothing about the last dollar you spent, which is the only one the next decision is about.
Spend rises, blended ROAS holds, and it looks fine. The average is being propped up by the efficient spend underneath it.
Nobody separates average return from marginal return. The last dollar can be under break-even for weeks while the headline number still looks healthy.
Fit the curve to your own history and you can see the point past which more budget stops buying anything new.
Everything happens in the browser. Your file never leaves the machine.
Daily spend and revenue, straight from the platform.
A diminishing returns model against your own numbers.
What the next dollar does, against break-even.
Where more spend stops buying incremental revenue.
Free, and yours to keep. If you want us to run this alongside a full account read, the audit does that.
Open the curve →